
3.2 Environment
3.2.1 Climate change
Climate change is becoming increasingly visible in the form of weather extremes such as heavy rainfall. Vitens is responding proactively by developing adaptive measures that strengthen the resilience of the water system, such as raising water wells to make them more resistant to flooding.
Together with our stakeholders, we are working towards a future‑proof and sustainable water system. Adapting to climate change is part that. At the same time, we are taking steps to reduce our own climate impact. We do this by reducing greenhouse gas emissions.
Resilience analysis
Vitens conducts a resilience analysis four times a year: the disruption risk analysis (VRA). In this analysis, the resilience of our strategy and business model (the way in which Vitens' drinking water supply as a whole has been organised and implemented) is tested against a variety of scenarios such as floods, droughts, wildfires and utility outages. The VRA has not yet explicitly accounted for a specific temperature increase. The VRA assesses for each scenario the likelihood, the potential impact on water quality and supply reliability, the number of affected customers and the duration of the disruption. The outcomes are evaluated annually and are a direct input for strategic decision-making, crisis preparation and multi-year investments. The VRA covers the entire Vitens' drinking water system and covers the short, medium and long term. The analysis is based on national scenarios, KNMI data and historical data. The VRA focuses on acute operational risks, such as flooding, drought and wildfire and not yet on transition risks in line with the Paris Agreement's climate targets. In the target structure, we take into account the long-term impact of climate change. Our aim is to work systematically to improve the robustness and flexibility of our infrastructure. This is explained in more detail under the heading ‘climate adaptation’.
Climate adaptation
Impact, risks, and opportunities
Vitens anticipates the impacts of climate change by taking increasing weather extremes into account in the design and development of its water abstraction areas.
| Sub-topic | Description of material impacts and/or financial risks and opportunities (own operation and value chain) |
|---|---|
| Financial materiality | Risks: |
| • Sites may have to be closed/moved due to drought | |
| • Actions may need to be taken to make sites climate adaptive (flooding, drought, forest fires) | |
| • Possibly more frequent damage to assets due to weather extremes |
Policies, actions, metrics, and targets
Climate change directly affects both the availability of water sources and the demand for drinking water. Climate change is leading to longer periods of warm and dry weather. As a result, water use is expected to increase, while at the same time drought intensifies and existing abstraction sites may come under pressure. In the current infrastructure there are few interconnections, which means that changes in drinking-water demand cannot be absorbed by other abstraction sites. Furthermore, our licences do not currently allow for any flexibility. In dry years they are required at more than 100% of their authorised capacity. All these challenges call for an approach that is future-proof and can therefore deal with these uncertainties.
To be prepared for these uncertainties, we worked on developing resilience in our infrastructure in 2025. Resilience means preparing for unknown changes so that the supply of reliable drinking water will continue to be guaranteed in the future. The way in which we build in resilience is set out in a document we refer to as the target structure. This includes, among other things, building in a more flexible and modular way. Another priority is the clustering of abstraction areas, enabling us to adapt more easily to changing conditions. We incorporate the physical climate risks shown in the table above (impacts, risks, and opportunities) into our design, asset-management, and investment decisions, ensuring that assets are better protected against drought, flooding, and extreme rainfall. Another focus area in 2025 was the further development of strategic hubs. These are areas where relatively large volumes of (surface) water can potentially be abstracted, with a relatively small impact on the surrounding environment and significant opportunities for societal value creation. In the long(er) term, this creates scope to reduce or close non-future-proof abstractions. We are also continuing to expand the transport infrastructure, aligned with the strategic hubs and the intended long-term reduction in the number of abstractions and production facilities. Becoming more resilient also means changing the way we work: shifting from a bottleneck-driven approach to adaptive planning, with active stakeholder involvement. We integrate functions such as drinking-water abstraction, agriculture, nature management and recreation in ways that are aligned with each area’s water system and soil characteristics. We address societal challenges through smart, integrated combinations. Panorama Waterland is the concept in which we realise this. At present, no specific targets have yet been established for this, as prescribed by the ESRS.
In the 2025 target structure, the focus was on reducing the vulnerability of our infrastructure and lowering our climate risks:
- Taking further steps to integrate the Panorama Waterland concept into our target structure. This concept focuses on future-proofing the entire water system—both groundwater and surface water—so that sufficient water remains available year-round for drinking-water abstraction, agriculture and nature. By integrating Panorama Waterland with the principles of the target structure, we are building a robust and resilient system for sustainable drinking-water abstraction. The implementation of this integration is taking place both within ongoing projects, such as Haarlo–Olden Eibergen, and in new initiatives arising from the strategic hubs of the target structure;
- A broad preliminary exploration of the strategic hubs in the IJssel Valley. For each region, we map out which groundwater and surface-water sources are available, what options exist to bridge periods of water scarcity, and what transport capacity is required to deliver treated water to the regions facing drinking-water shortages. This helps us to further define and prioritise the search areas for new sources, and it creates the link between Vitens’ target structure and the provinces’ adaptive drinking-water strategies.
Climate mitigation and energy
Impact, risks, and opportunities
Vitens has a negative impact within the theme of climate impact and energy. This is due to greenhouse gases and energy use. Vitens is taking measures, such as methane capture and processing, to reduce its own emissions. The table below presents the impacts, risks and opportunities (IROs) as recorded in the context of determining material topics.
| Sub-topic | Description of material impacts and/or financial risks and opportunities (own operation and value chain) |
|---|---|
| Impact materiality | Impact (negative): |
| • Emissions and energy use contribute to climate change |
Policies, actions, metrics, and targets
Vitens' climate mitigation policies and plans are not yet fully in line with all ESRS requirements. However, Vitens has drawn up an integrated policy 'Energy and greenhouse gas emissions' to limit the negative impact of its business operations on the climate. Our policy is based on national reduction targets as laid down in the Dutch Climate Act (2019 version), which is aimed at the Netherlands’ contribution to the Paris Climate Agreement. In line with disclosure requirements TV1 and TV2 of ESRS E1, this means that we apply the national reduction percentage (from 2019) to our own greenhouse-gas emissions. This means that we are aiming for a 49% reduction in emissions by 2030 and climate neutrality by 2050.
Through this policy, Vitens steers the reduction of the negative impact of emissions and energy use on the climate, as identified in the double materiality assessment. The policy aims to purposefully manage and reduce this material impact through the four strategies:
1. Reduction strategy: Vitens reduces energy consumption and direct greenhouse gas emissions by:
- energy-efficient infrastructure design;
- application of internal CO2 pricing;
- mandatory energy and emission assessments;
- reducing energy waste and methane emissions.
2. Production strategy: Vitens exploits its potential to generate renewable energy on its own sites, such as:
- solar panels and methane recovery;
- mandatory implementation of measures that pay for themselves;
- anaerobic digestion of green waste for energy recovery.
3. Offset strategy: Vitens offsets part of its emissions from electricity use by purchasing green electricity.
4. Innovation strategy: Vitens makes targeted investments in innovations that contribute to achieving energy and emission targets, with an emphasis on eliminating scope 1 emissions.
Based on these strategies, Vitens has identified generic emission-reducing measures that help manage the negative climate impact of emissions and energy use, as they are aimed at reducing energy consumption and greenhouse-gas emissions. These provide concrete guidance for making an integrated assessment of costs, performance and risks when developing the investment portfolio. In assessing performance, this includes not only security of supply and water quality, but also the reduction of greenhouse-gas emissions and energy consumption.
Because many emission-reducing measures are integrated into the primary production process, it is neither practically feasible nor effective to implement them separately, for example through standalone projects (whether or not as part of a transition plan). Instead, measures are incorporated into regular investment projects when our production facilities are replaced or expanded, and we do not have a transition plan. Vitens is working towards finalising a transition plan within three years. In addition to the identified emission reduction measures, applying the aforementioned internal CO2 cost price gives an additional incentive to include emission reductions in investment projects.
Actions in 2025 are:
- As part of the Solar Power 3 project, solar panel installations have taken place at three locations in 2025, namely Beerschoten, Manderveen and Hoge Hexel. Together, these have delivered nearly eighty MWh, saving about twenty tonnes of CO2 equivalents. Over the next two years, we expect to install solar panels at a further forty sites (KT).
- Various new-build and refurbishment projects at production sites were prepared in 2025, with methane capture and processing forming part of the project scope. The sites in question are Noordburgum (LT), Luxwoude (LT) and St Jansklooster (LT). These preparations contribute significantly to reducing methane emissions.
- In our procurement processes, we take the potential use of electric equipment into account in our assessments (MT).
Metrics and targets
Because a sector-specific 1.5°C pathway is not yet available for the drinking water sector, we use the national target as our reference point. The translation of the national target to company level is carried out by applying the national reduction percentage to our total scope 1, scope 2 and relevant scope 3 emissions from 1990. This means that we are aiming for a 49% reduction in emissions by 2030 and climate neutrality by 2050. In 2026, we will revise our targets to better reflect the requirements of the ESRS E1 standard. Until then, we will report transparently on our progress and the steps we are taking to further align our strategy and policies with our reduction targets.
In reporting year 2025, we revised our methodology for calculating scope 3 greenhouse gas emissions. Previously, we made use of sector agreements wherever possible, as set out in the Drinking Water Practice Code (PCD‑11). We expanded scope 3 emissions this year in line with the GHG Protocol Corporate Value Chain (Scope 3) Accounting and Reporting Standard that provides a more complete picture of the overall climate impact of our emissions in the value chain.
For scope 3, in line with the agreements in PCD‑11, we have used activity data (physical units such as weight, volume and distance) wherever available. For the remaining part of scope 3, we made calculations based on emission factors per euro of procurement (spend-based method). In a parallel process, PCD‑11 is being further developed by the Dutch drinking water sector to enable reporting in accordance with ESRS standard E1, and to ensure harmonisation between the drinking water companies.
These changes were made to better align with international reporting standards and to increase the transparency and comparability of our sustainability data.
| Metric | Target 2025* | Result 2025 | Result 2024** |
|---|---|---|---|
| Greenhouse gas emissions (site-based) in tonnes CO2-eq | * | 321.937 | 281.143 |
| Greenhouse gas emissions (market-based) in tonnes CO2-eq | * | 285.960 | 237.878 |
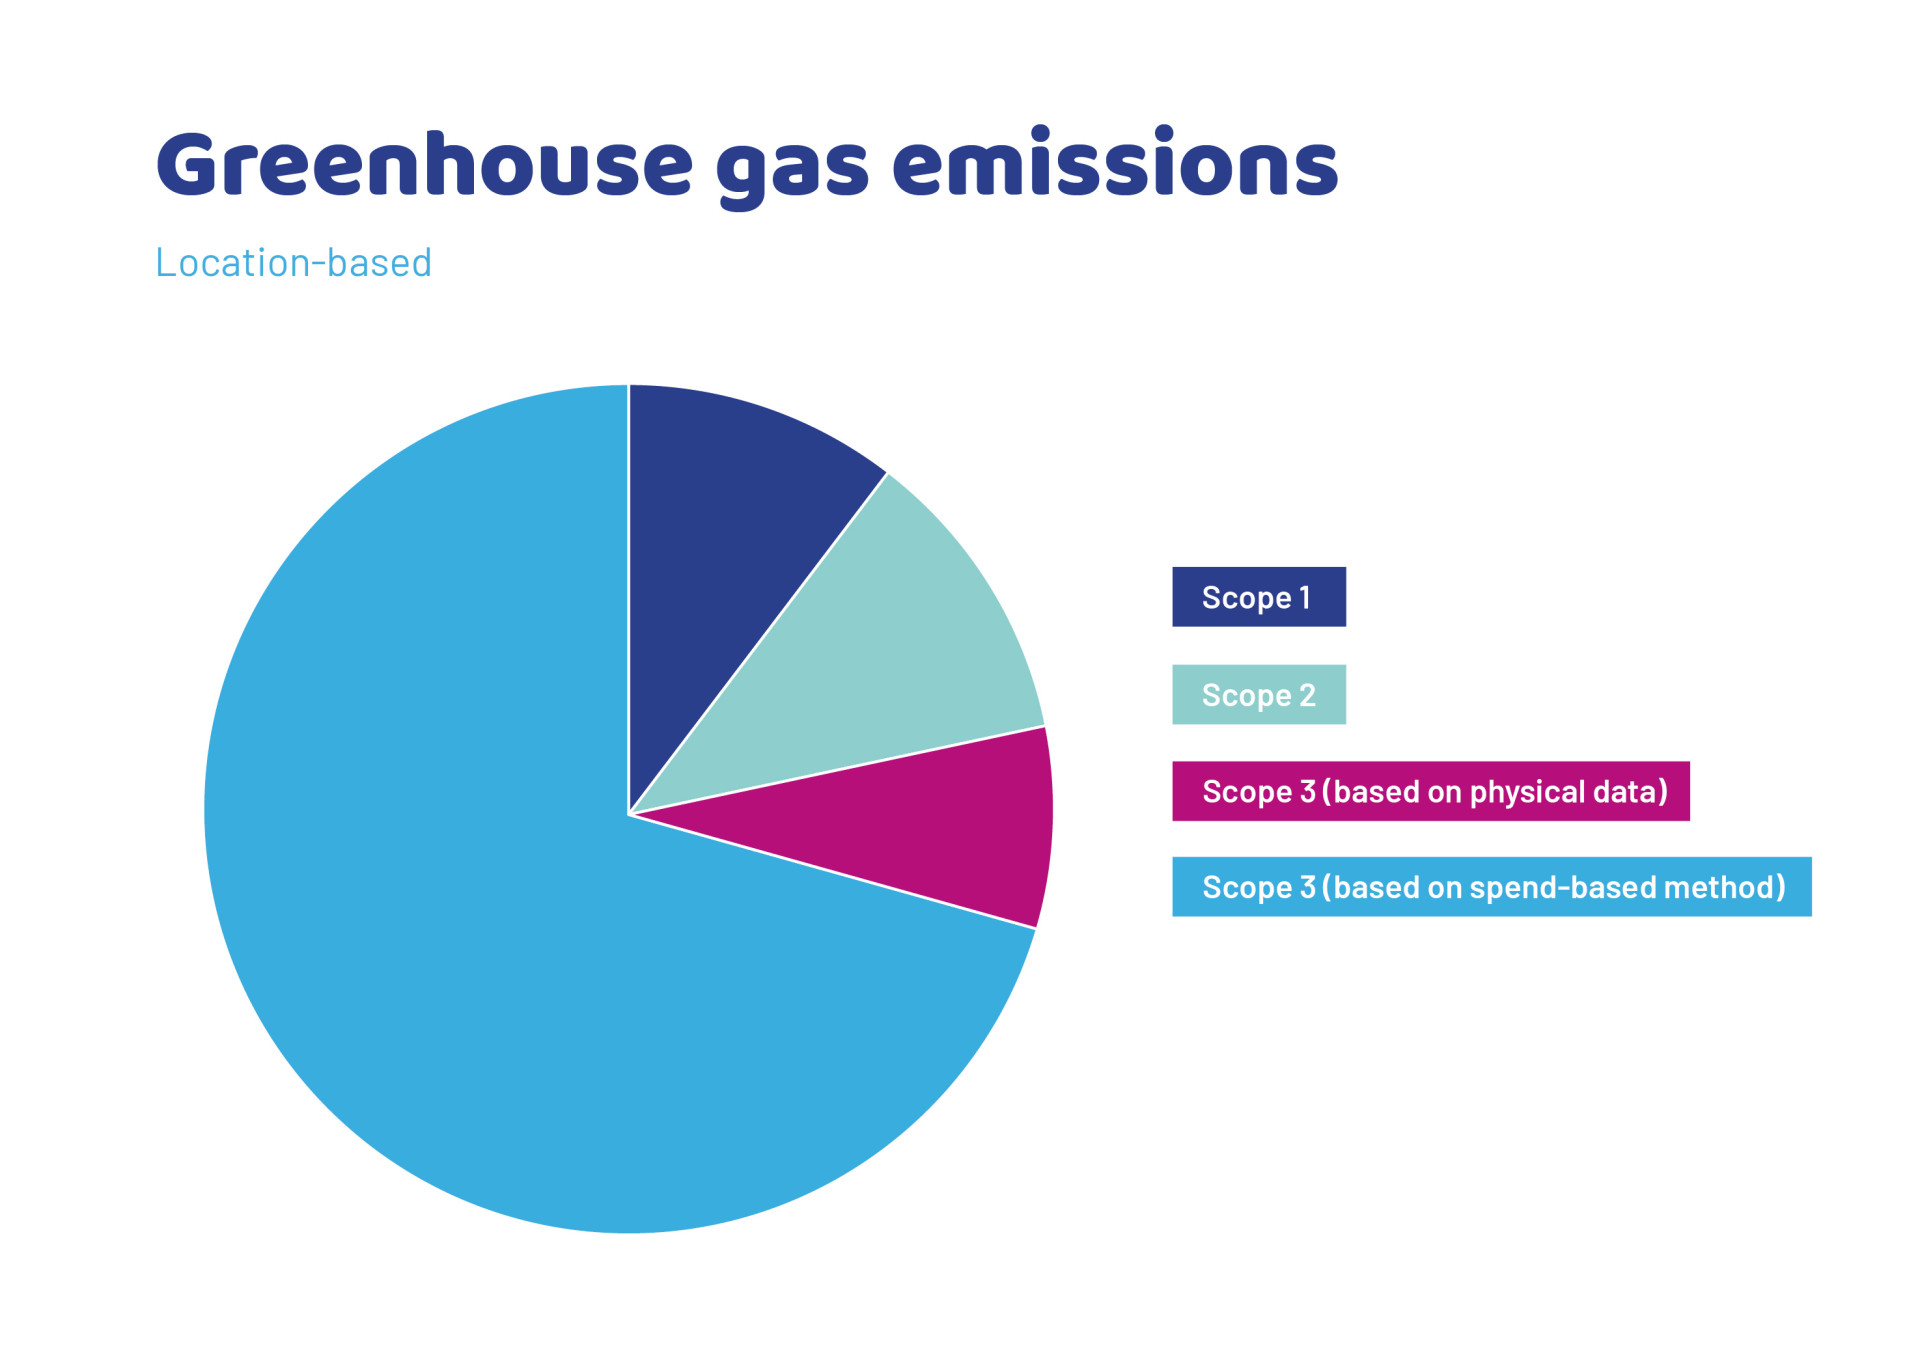
The distribution of greenhouse gas emissions on a location-based basis across scope 1, scope 2 and scope 3 is shown in the graph below:
The table below shows the total energy consumption and energy mix from own operations in absolute values (Mwh).
| Energy consumption and energy mix | 2025 | 2024 |
|---|---|---|
| (1) Fuel consumption from coal and coal products (MWh) | ||
| (2) Fuel consumption from crude oil and petroleum products (MWh) (a) GTL | 2.182 | 2.509 |
| (2) Fuel consumption from crude oil and petroleum products (MWh) (b) Petrol | 161 | 309 |
| (2) Fuel consumption from crude oil and petroleum products (MWh) (c) Diesel | 5.022 | 5.264 |
| (3) Fuel consumption from natural gas (MWh) | 4.061 | 4.620 |
| (4) Fuel consumption from other fossil sources (MWh) | - | - |
| (5) Consumption of electricity, heat, steam and cooling purchased or acquired from fossil sources (MWh) | 2.139 | 161.891 |
| (6) Total fossil energy consumption (MWh) | 13.564 | 174.593 |
| Share of fossil sources in total energy consumption (%) | 7% | 94% |
| (7) Consumption from nuclear sources (MWh) | - | - |
| Share of consumption from nuclear sources in total energy consumption (%) | 0% | 0% |
| (8) Fuel consumption from renewable sources, incl. biomass (also industrial and municipal waste of biological origin, biogas, hydrogen from renewable sources, etc.) (MWh) | 8.325 | 8.934 |
| (9) Consumption of purchased or acquired electricity, heat, steam and cooling from renewable sources (MWh) | 163.529 | - |
| (10) Self-generated renewable energy consumption from non-fuel sources (non-fuel) (MWh) (a) hydropower | 59 | 54 |
| (10) Consumption of self-generated renewable energy from sources other than fuel (non-fuel) (MWh) (b) solar energy | 2.357 | 2.250 |
| (11) Total renewable energy consumption (MWh) | 174.271 | 11.238 |
| Share of renewable sources in total energy consumption (%) | 93% | 6% |
| Total energy consumption (MWh) | 187.835 | 185.831 |
Explanation:
- Total energy consumption in 2025 is almost the same as in 2024, but the balance between fossil and renewable energy has changed markedly. This is because Vitens switched to a new contract for green electricity with guarantees of origin (bundled) in 2025. In 2024, grey electricity was purchased with separate guarantees of origin (unbundled). As a result, electricity in 2025 is classified as renewable, whereas the same electricity fell under the fossil category in 2024.
- Energy consumption has been determined based on the same activity data used to calculate greenhouse gas emissions.
- Where necessary, quantities have been converted to applicable units. In doing so, conversion factors that are both representative and reducible were used, in accordance with applicable guidelines.
Based on our NACE codes, we qualify as a sector with a significant climate impact. This is our energy intensity:
| Energy intensity per net yield | 2025 | 2024 | % change |
|---|---|---|---|
| Total energy consumption of activities in high climate impact sectors per net output of activities in high climate impact sectors (MWh/€ million ) | 299 | 346 | -13% |
Explanatory notes for the table:
The decrease in energy intensity in 2025 is explained by higher operating revenues from business activities.
We report our greenhouse gas emissions in line with the Greenhouse Gas Protocol.
| Retrospective | Milestones and annual target* | |||||||
|---|---|---|---|---|---|---|---|---|
| Base year *** | 2024 | 2025 | % 2025 / 2024 | 2025 | 2030 | 2050 | Annual target (%)/ base year | |
| Scope 1 emissions | ||||||||
| Gross scope 1 emissions | 32.781 | 35.136 | 32.781 | -7% | ||||
| Percentage of scope 1 emissions from regulated emissions trading schemes (%) | - | - | - | |||||
| Scope 2 emissions | ||||||||
| Gross site-based scope 2 emissions (tonnes CO2-eq) | 36.447 | 43.710 | 36.447 | -17% | ||||
| Gross market-based scope 2 emissions (tonnes CO2-eq) | 470 | 445 | 470 | 6% | ||||
| Significant Scope 3 emissions ** | - | |||||||
| Total gross indirect (scope 3) emissions (tonnes CO2-eq) | 252.709 | 202.298 | 252.709 | 25% | ||||
| 1 Purchased goods and services | 71.290 | 59.873 | 71.290 | 19% | ||||
| 2 Capital assets | 160.341 | 119.406 | 160.341 | 34% | ||||
| 3 Fuel and energy activities (not included in scope 1 or scope 2) | 8.707 | 10.224 | 8.707 | -15% | ||||
| 4 Upstream transport and distribution | 581 | 504 | 581 | 15% | ||||
| 5 Waste generated through activities | 8.109 | 8.394 | 8.109 | -3% | ||||
| 6 Business travel | 178 | 203 | 178 | -13% | ||||
| 7 Employee commuting | 718 | 621 | 718 | 16% | ||||
| 8 Upstream leased assets | 118 | 140 | 118 | -16% | ||||
| 9 Downstream transport | 381 | 571 | 381 | -33% | ||||
| 15 Investments | 2.286 | 2.362 | 2.286 | -3% | ||||
| Total greenhouse gas emissions | ||||||||
| Total greenhouse gas emissions (site-based) (tonnes CO2-eq) | 321.937 | 281.143 | 321.937 | 15% | ||||
| Total greenhouse gas emissions (market-based) (tonnes CO2-eq) | 285.960 | 237.878 | 285.960 | 20% | ||||
Explanation:
By 2025, Vitens' total greenhouse gas emissions increased compared to 2024. This increase is almost entirely due to higher capital expenditure. Within CO2- reporting, these investments fall under scope 3 (indirect value-chain emissions), and investment volumes were higher in 2025 than in 2024. As the scope-3 calculation is largely based on financial expenditures (so-called spend-based analysis), a higher investment sum leads directly to higher related greenhouse gas emissions. Location‑based emissions from electricity have decreased, mainly due to the greening of the average Dutch electricity mix.
Explanation of greenhouse gas emission accounting principles:
- Greenhouse gas emissions are determined for the reporting year based on Vitens' activities in that year with emissions in scope 1, 2 and 3. Where possible, data on the activities themselves (including their physical characteristics), such as kilometres driven, are used. For scope 3 - in those cases where no physical activity data are available - emissions are estimated using financial data describing the transaction value of the activity (the so-called spend-based method). Of the resulting total greenhouse gas emissions, approximately 30% is based on activity data and around 70% is estimated using financial data.
- Activity data are multiplied by emission factors. In doing so, the following sources of emission factors are used:
- For physical activity data (e.g. kWh electricity consumed), emission factors taken from co2emissiefactoren.nl are used.
- The emission factors of chemicals used are taken from the PCD-11, which uses EcoInvent 3.10.
- The emission factors in the spend analysis are taken from the Climatiq database, which uses data from Exiobase.
- The greenhouse gas potential of methane is taken from PCD-11, which uses IPCC Assessment Report 6.
- The method for scope 1 and 2 and a number of scope 3 activities (commuting, procurement and transport of chemicals and drinking water procurement) is described generically for Dutch drinking water companies in the Drinking Water Code of Practice (PDC-11) 'Calculation of CO2 Footprint of Drinking Water Companies' by the Water Research Institute (KWR). The emission factors in that method are taken from co2emissiefactoren.nl
- Where necessary, and within the methodology set out in PDC‑11, Vitens makes its own estimates, such as for gas consumption (estimated on the basis of the previous year’s consumption data) and for the composition of chemicals used (estimated on the basis of the invoiced consumption of the previous year and adjusted to the volume of drinking water supplied to the network).
- For location-based emissions, the grid mix is used based on co2emissionfactors.co.uk. The market-based emission factors use the hierarchy described in the GHG Protocol scope 2 guidance. In 2024, grey electricity was purchased with separate GOs (unbundled), whereas in 2025, with a new energy supplier, green electricity with bundled GOs was procured.
- For the emergency power systems that are not equipped with a running-hour counter, an estimate is made based on the running hours as prescribed in the system's test regime.
- Two financial adjustments are applied in the spend analysis:
- When using data from Climatiq in currencies other than euro, an exchange rate is applied. This is determined on the basis of the average exchange rate for the reporting year as published by the European Central Bank.
- For Climatiq values that refer to periods earlier than the reporting year, an inflation adjustment is applied. The inflation value is determined on the basis of CBS data.
- In line with ESRS E1, Vitens uses the Tank to Wheel CO2-emission factors for fuel and energy-related activities in Scopes 1 and 2. Indirect chain emissions are reported (Well to Tank) in category 3 of scope 3.
- The following categories within scope 3 are not applicable to Vitens:
- Category 10, 11 and 12: Vitens does not include scope 3 categories 10 (processing of sold product), 11 (use of sold product) and 12 (end-of-life of sold product) in its calculation. Vitens' primary product is drinking water. Water does not have an end-of-life phase like other products. Any emissions generated downstream in the water chain occur indirectly, for example as a result of water heating. Within the Greenhouse Gas Protocol, organisations are permitted not to report indirect emissions arising during the use phase. Vitens opts for this approach because the water is supplied primarily as drinking water, and any subsequent processing is not directly linked to the use of that product. The emissions resulting from, for example, gas used to heat shower water are so much higher than the emissions from drinking water production that including them would give a highly distorted picture. Furthermore, it falls outside Vitens' direct area of influence. Residues delivered by Vitens to Aquaminerals are considered waste streams and do not fall under the definition of 'product' within these categories.
- Category 13: Leased buildings is not considered material.
- Category 14: Vitens has no franchises.
- Category 15: The activities of Facturatie B.V. and (part of the activities) of VEI B.V. take place in Vitens' offices, so part of the scope 1 and 2 emissions are caused by these entities. However, this data cannot be separated and is therefore accounted for by Vitens, the impact of which is not material. In addition, for VEI B.V., emissions from air travel are allocated 50% to Vitens, in line with Vitens' 50% interest in this joint venture. Emissions from Aquaminerals B.V. are included in 3.9 (transport). Application of the residual streams supplied by Aquaminerals lead to avoided emissions. Vitens chooses not to report these (yet). No emission data are available for KWH Water B.V.; an estimate has therefore been made based on the expected revenue.
Greenhouse gas intensity is an important indicator of the environmental efficiency of the production process. The table below shows the total greenhouse gas intensity:
| Greenhouse gas intensity tonne CO2-eq/net revenue in million € | 2025 | 2024 | % change |
|---|---|---|---|
| Greenhouse gas intensity (site-based) | 513 | 523 | -2% |
| Greenhouse gas intensity (market-based) | 456 | 443 | 3% |
Internal calculation price greenhouse gas emissions
Vitens applies an internal carbon price for greenhouse gas emissions in policymaking, virtually all investment decisions, and the design and procurement of products and services. This price is €100 per tonne of CO2-equivalent, as determined by the BoD and forms an integral part of the Total Cost of Ownership analysis which takes into account the total costs of the investment and throughout the entire lifetime of the asset. When considering multiple design options, the additional emissions from more polluting alternatives can thus be converted into extra (notional) costs, making the more sustainable options financially more attractive in the comprehensive assessment of costs, performance and risks. The level of the internal carbon price has been set in line with the Social Cost–Benefit Analyses conducted by the Netherlands Bureau for Economic Policy Analysis and the Netherlands Environmental Assessment Agency, which determine the societal cost of CO2 emissions in light of the reductions required under the Paris Agreement. The sensitivity analysis in 2020 showed €100 per tonne of CO2-equivalent to be an effective figure. This amount is now less effective; a proposal to increase it will be made in 2026.
The following sources were used to determine the CO2-pricing of €100 per tonne of CO2-equivalent:
- CO2-pricing at drinking water utilities, Arcadis report C05011.000672.0120 dated 18 December 2020, commissioned by Blue Networks.
- The Netherlands in 2030–2050: Two Reference Scenarios – Exploring Future Welfare and the Living Environment', PBL (Netherlands Environmental Assessment Agency) and CPB (Netherlands Bureau for Economic Policy Analysis), 2015.(www.wlo2015.nl).
3.2.2 Water and marine resources
As the largest drinking water company in the Netherlands, we take responsibility for managing water resources sustainably, minimising our environmental impact and safeguarding security of supply. The availability of sufficient water resources is under pressure due to climate change, spatial pressure and increasing water demand. In some regions, even the licensed abstraction capacity is at risk of becoming insufficient. Moreover, the Netherlands has traditionally been set up to drain water as quickly as possible. This is detrimental to groundwater levels and thus to nature, agriculture and drinking water companies such as Vitens.
Due to the pressure on the availability of sufficient water sources, Vitens is focusing not only on developing new sources, but also on reducing the demand for drinking water. Through our Water Conservation Programme, we encourage households and businesses to use water consciously and sustainably. For business customers, Vitens also actively manages demand by assessing applications for appropriate use and, where necessary, imposing conditions or refusing connections to safeguard security of supply.
The themes of water abstraction and water conservation are detailed in this chapter.
Water abstraction
Vitens is responsible for ensuring there is enough drinking water. To continue doing so, sufficient and sustainable sources are essential. These sources are located within our abstraction areas: protected zones where Vitens abstracts groundwater.
Due to increasing demand, Vitens needs more permits in the short term to abstract (ground) water to make drinking water. These permits can only be obtained through collaboration with our water partners. Complex, lengthy permit procedures and competing interests in the living environment are major bottlenecks in having permits available on time. This is often due to the difficulty of integrating it into the local environment. In addition to regional differences in bottlenecks, constraints such as shortages of staff and resources, nitrogen regulations and grid congestion are increasingly affecting the timely granting of permits. For the long(er) term, beyond 2030, Vitens is working with stakeholders to create a robust system with drinking water abstraction that have the least possible impact on nature and the environment. For this, we are also looking at alternative sources to make drinking water from. By supplementing groundwater with surface water and bank-filtered water, Vitens increases available source capacity and strengthens resilience to weather extremes such as prolonged drought.
This is how we develop a future-proof and sustainable water system. This is a process that takes several decades. That is why, in the coming years, we will continue to develop additional groundwater abstraction, but in the most sustainable way possible. Finally, it is not only the way we abstract water that must change. It is also important that (business) customers use drinking water responsibly. In short: sustainable drinking water abstraction covers the entire chain.
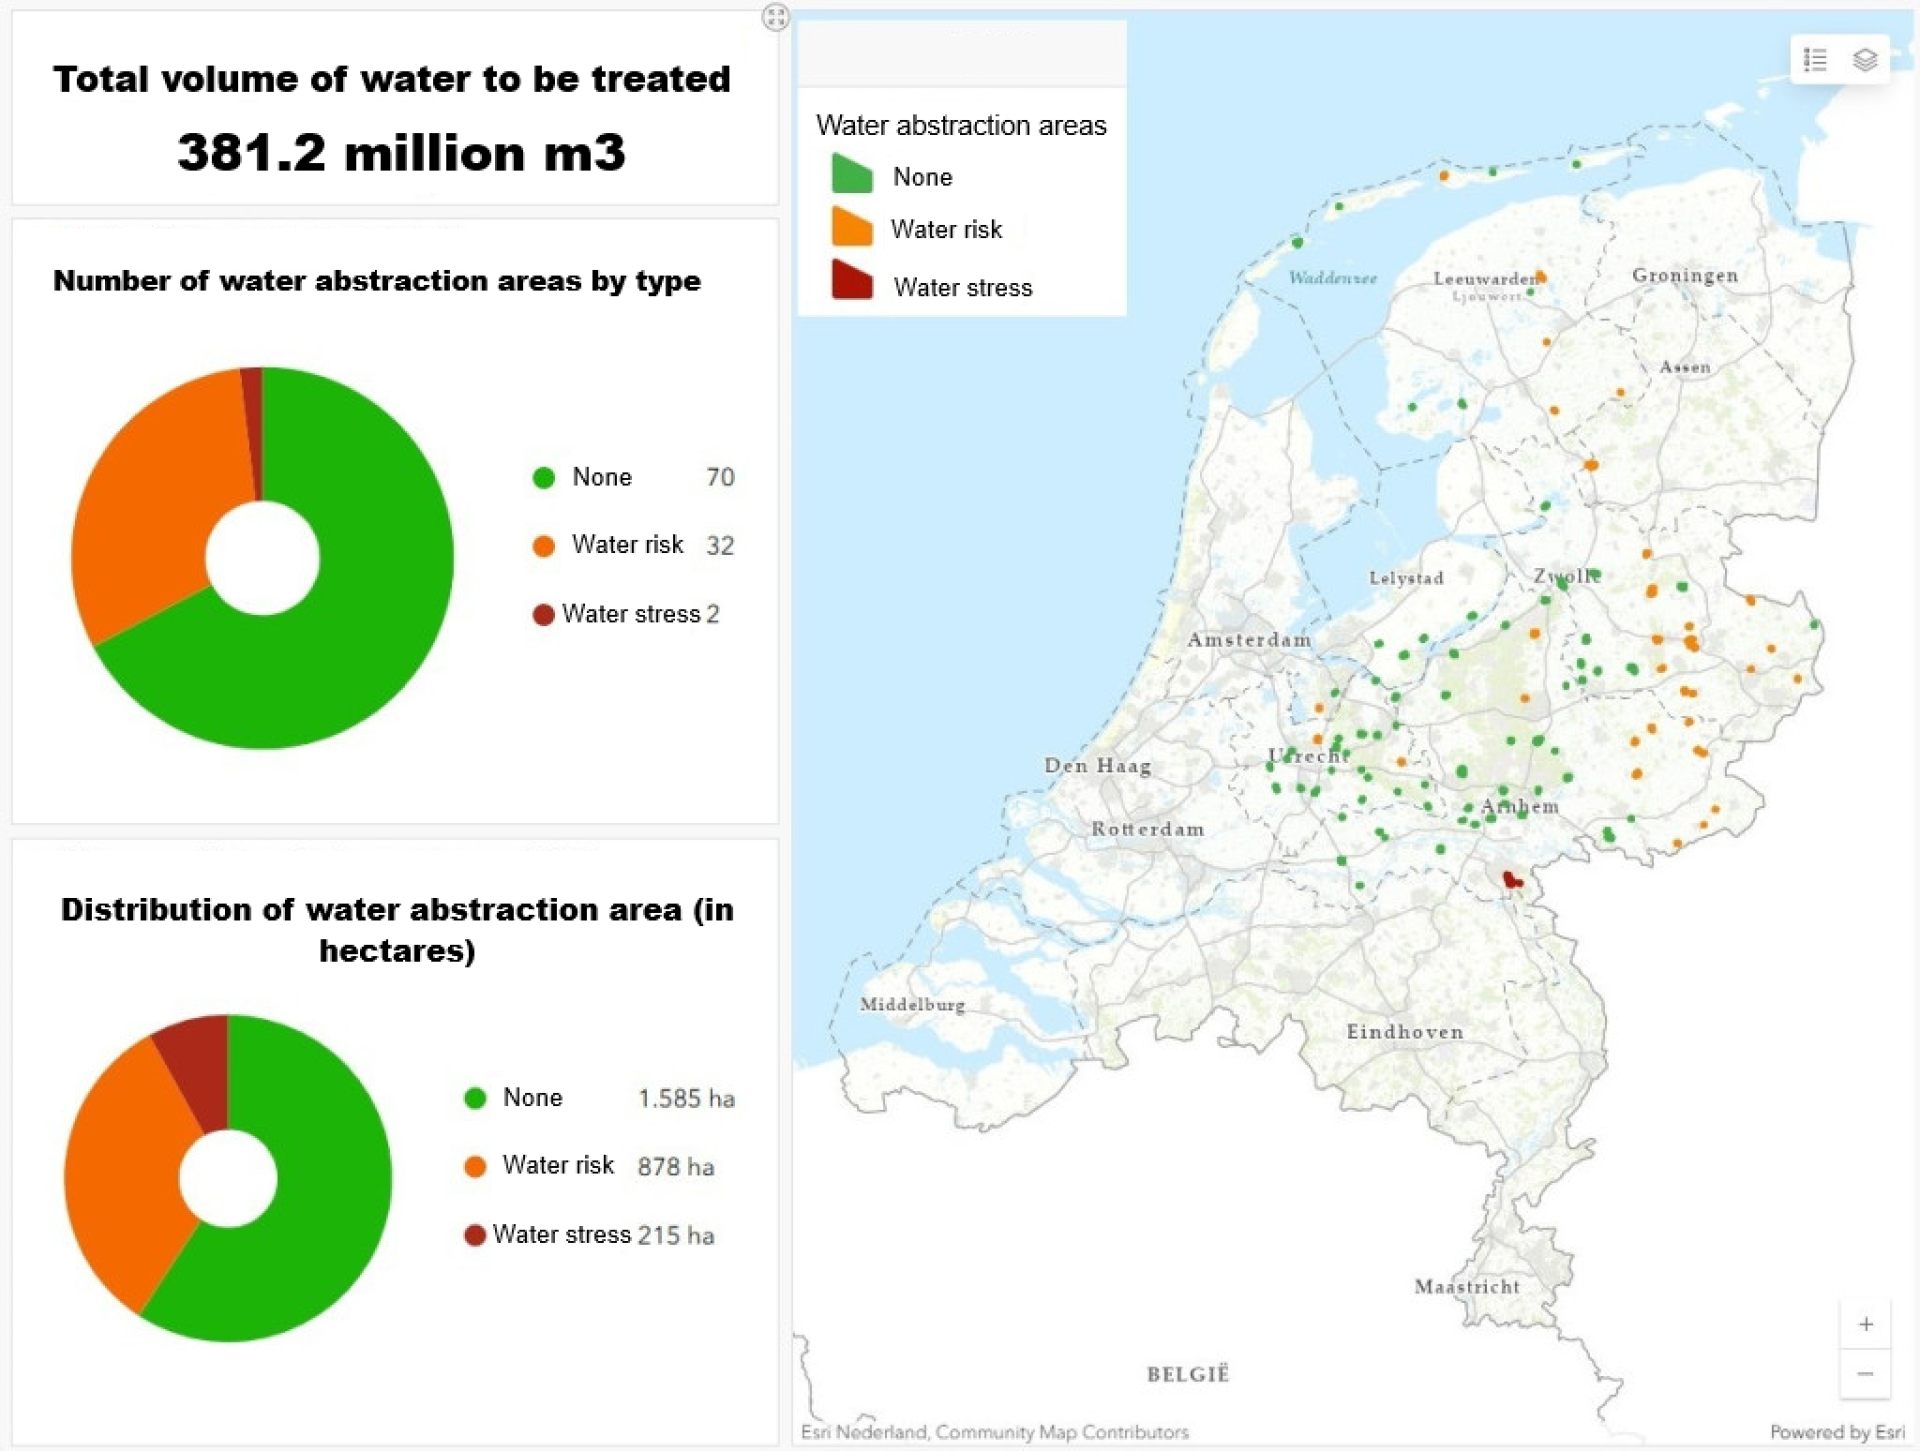
The map below shows which abstraction sites used for drinking water production are exposed to water risk and water stress. In 2025, the total volume of water abstracted at our production sites for treatment is 381.2 million m³.
Impact, risks, and opportunities
Water scarcity is a growing challenge in the Netherlands due to climate change and increasing demand for drinking water. In the table below, Vitens presents the impacts, risks and opportunities (IROs) as established in the materiality assessment.
| Sub-topic | Description of material impacts and/or financial risks and opportunities (own operation and value chain) |
|---|---|
| Impact materiality | Impact (negative): |
| • Vitens uses scarce groundwater as its main source of drinking water production. | |
| Financial materiality | Risks: |
| • Developing new sites leads to higher costs and permit pressure | |
| • New extractions and alternative sources may be needed: more complex treatment leads to higher costs and permit pressure | |
| Opportunity: | |
| • Source diversification, despite higher costs, makes Vitens less vulnerable to external influences and thus reduces the risk of outages and disruption of water supply. |
Policy
Vitens has a reserve policy to ensure continuity of drinking water supply. By maintaining strategic additional abstraction capacity, we anticipate future growth in water demand, negative impacts on source availability and increasing spatial pressures. If insufficient new abstraction areas are identified rising water demand could lead to declining reserves and shortages in the drinking water supply. To limit negative impacts, we ensure sustainable abstraction, whereby withdrawals do not exceed the (natural) recharge of the source. In addition, as a drinking water company we are required to comply with the maximum licensed abstraction capacity.
Measures to be taken in 2025 to ensure sufficient production capacity
- Production capacity in Utrecht has been expanded at Cothen. This is offset by the closure of the Doorn production site due to the vulnerability of this abstraction.
- Production capacity in Overijssel has been increased through the expansion of the treatment plant in Vechterweerd. In addition, an operational restriction at the Ceintuurbaan site has been lifted. The planned expansion of production capacity in Overijssel near Diepenveen has been postponed to early 2026.
Actions in 2025 to ensure sufficient reserves (permits) are in place
In 2025, intensive work was carried out to secure and expand the drinking water supply. This has been achieved through a package of explorations, studies and collaborations:
- To foster understanding about drinking water supplies and include the surrounding area in Vitens' plans, regular residents’ meetings and stakeholder workshops were organised to keep the area engaged in the developments. During the exploratory phase, stakeholders were actively involved in the process to identify additional abstraction capacity.
- In the province of Utrecht, a Drinking Water Council has been established. A governance partnership between several municipalities, water authorities, drinking water companies Oasen and Vitens and the province of Utrecht to accelerate the drinking water task.
- In 2025, substantial progress was made on the ongoing integrated explorations (including those for Eemdijk and Southern Flevoland) and on studies required to obtain additional permit capacity for groundwater abstraction for drinking water supply:
- Extensive research has been carried out across various work programmes. At Schalkwijk, this included the installation of deep monitoring wells, as well as cone penetration tests and soil investigations. This further refines the groundwater model. In collaboration with the surrounding stakeholders, knowledge has been developed about the subsurface structure and how it should be represented in the groundwater model;
- Within WAAG (Water Supply and Supplementation in the Gooi), both an official and an administrative steering group have been established to set the strategic direction, take decisions, and secure political–administrative support for the project. In addition, a groundwater model has been developed together with the groundwater advisory group (environmental stakeholders) to determine the effects of groundwater abstraction and/or infiltration;
- Apeldoorn-Noord: In 2025, the province, the municipality and the water authority entered into a letter of intent to work together on an integrated spatial design encompassing all tasks in the area;
- Gelderse Valley: The first phase of the exploratory fieldwork has been reported, and the sustainable concepts study has been completed. The study worked with local authorities, the county council and the water board to identify potential sustainable concepts and map out opportunities for combining functions with drinking water abstraction at ground level;
- Epe: Case law (the Rendac ruling) led to an adjustment of the justification in the permit application. The effects of extreme conditions (drought and flooding) are also being examined in more detail. In 2026, an information evening will be held, after which the province can proceed with the draft decision;
- Winsen-Slijk-Ewijk: in 2025, Vitens started exploring different options for abstracting drinking water in this reserve area. The water authority and the province are involved in this. Exploratory hydrological calculations have been carried out and exploratory drilling is being prepared for mid-2026. In 2026, the exploratory phase will continue with further studies and an environmental impact assessment process.
- Fikkersdries: the environmental impact assessment 1st phase has been delivered in draft. Based on this, a preferred alternative will be chosen in 2026 and further developed for the continuation of the licensing procedure.
Metrics and targets
Sufficient production capacity
Sufficient production capacity is needed to respond flexibly to changes in drinking water demand. If this is not adequately secured, we may have to lower water pressure during peak demand (such as in dry, hot periods) to ensure we can continue supplying drinking water to our customers.
The operational gap is the difference between the required production capacity (current drinking‑water demand +10%) and the currently available annual production capacity. The metric ‘number of clusters with a positive operational gap’ indicates how many of our ten clusters possess adequate production capacity.
Results 2025
| Metric | Target 2025 | Result 2025 | Result 2024 |
|---|---|---|---|
| Number of clusters with a positive operating margin | 5 | 4 | 6 |
Explanation:
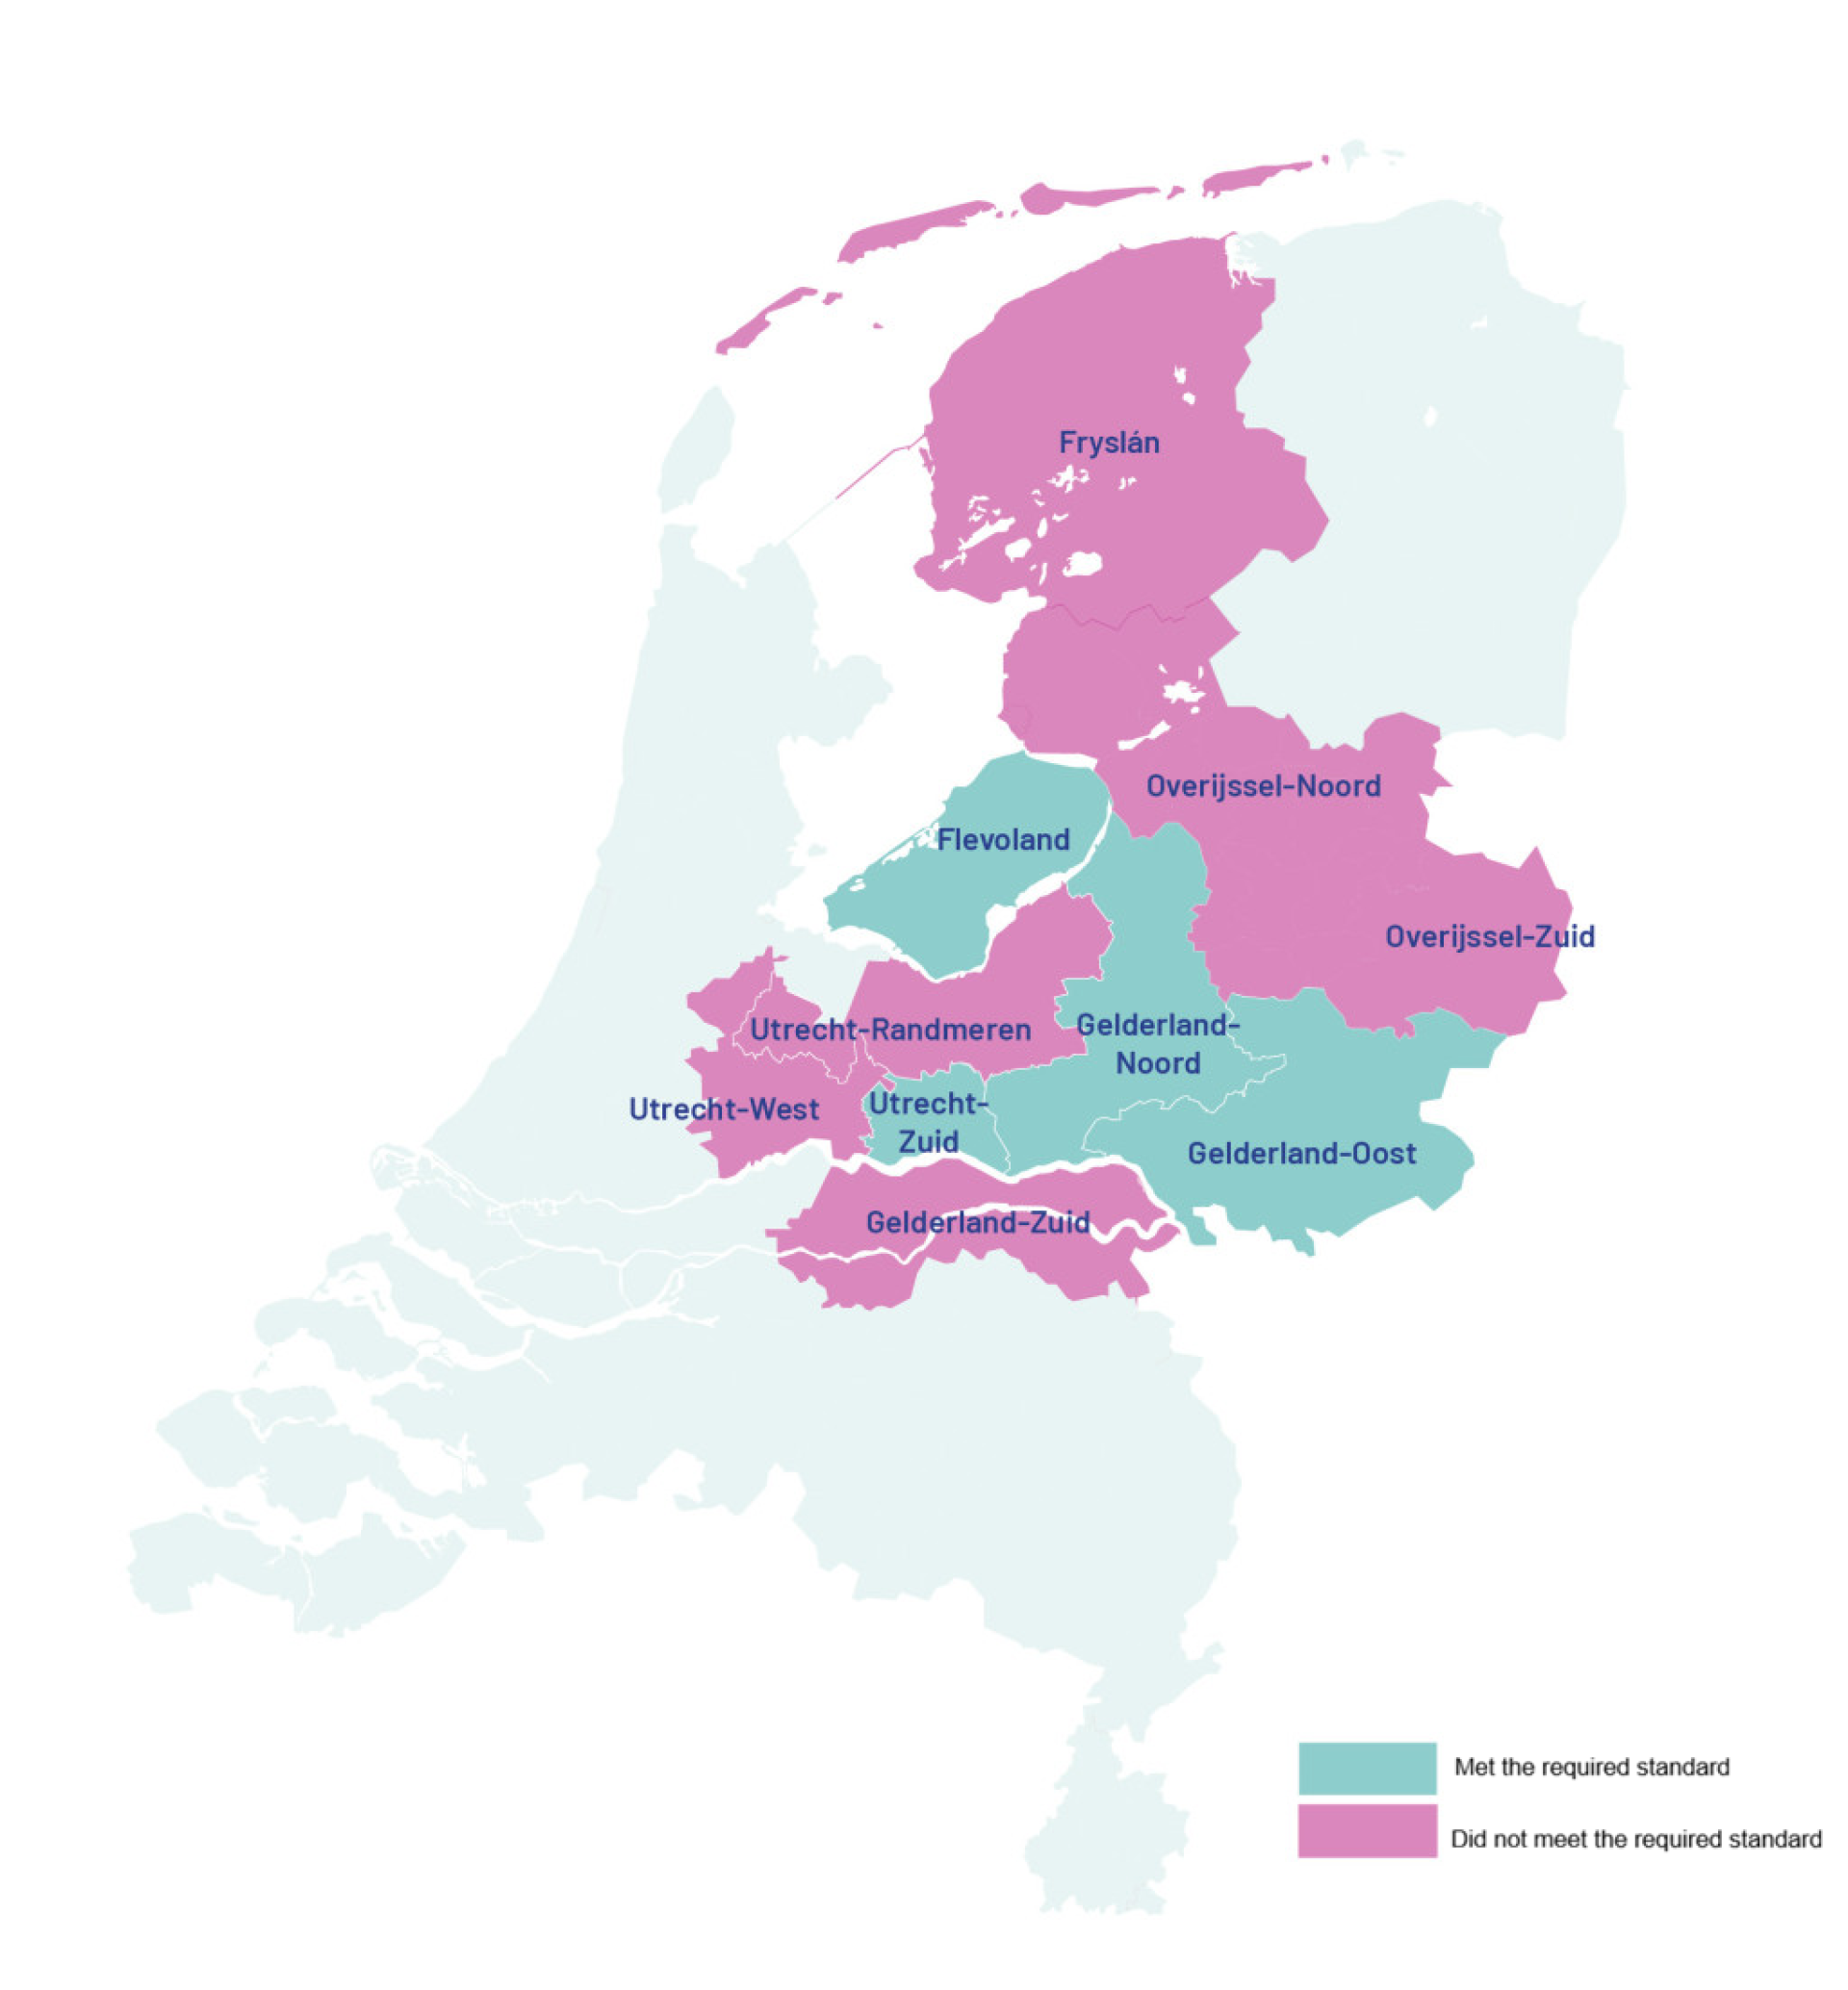
In 2025, only four of the 10 clusters had sufficient production capacity to meet the growing demand for drinking water: Gelderland-Oost, Flevoland, Gelderland-Noord and Utrecht-Zuid. In 2024, two additional clusters met the required standard. This marks a decline relative to 2024, when six clusters met the required standard. The two clusters now fall short as a result of a modest rise in drinking-water demand, whereas planned increases in production capacity did not take place. The rising trend in drinking-water demand calls for initiatives to increase production capacity in order to keep supply and demand in balance. On the basis of current insights, our original 2020 objective of bringing all clusters into compliance by 2030 has become unachievable. We will therefore review our targets for the coming years next year, to better reflect reality.
The map below shows, by geographic area, which clusters have sufficient production capacity:
Sufficient permits
Sufficient permits and therefore sufficient reserves are essential to meeting water demand now and in the future. This means that each cluster must have 10% more permitted abstraction capacity than the required production need (current drinking‑water demand + a 10% buffer).
Result 2025
| Metric | Target 2025 | Result 2025 | Result 2024 |
|---|---|---|---|
| Number of clusters with sufficient Total Reserves | 5 | 4 | 4 |
Explanation:
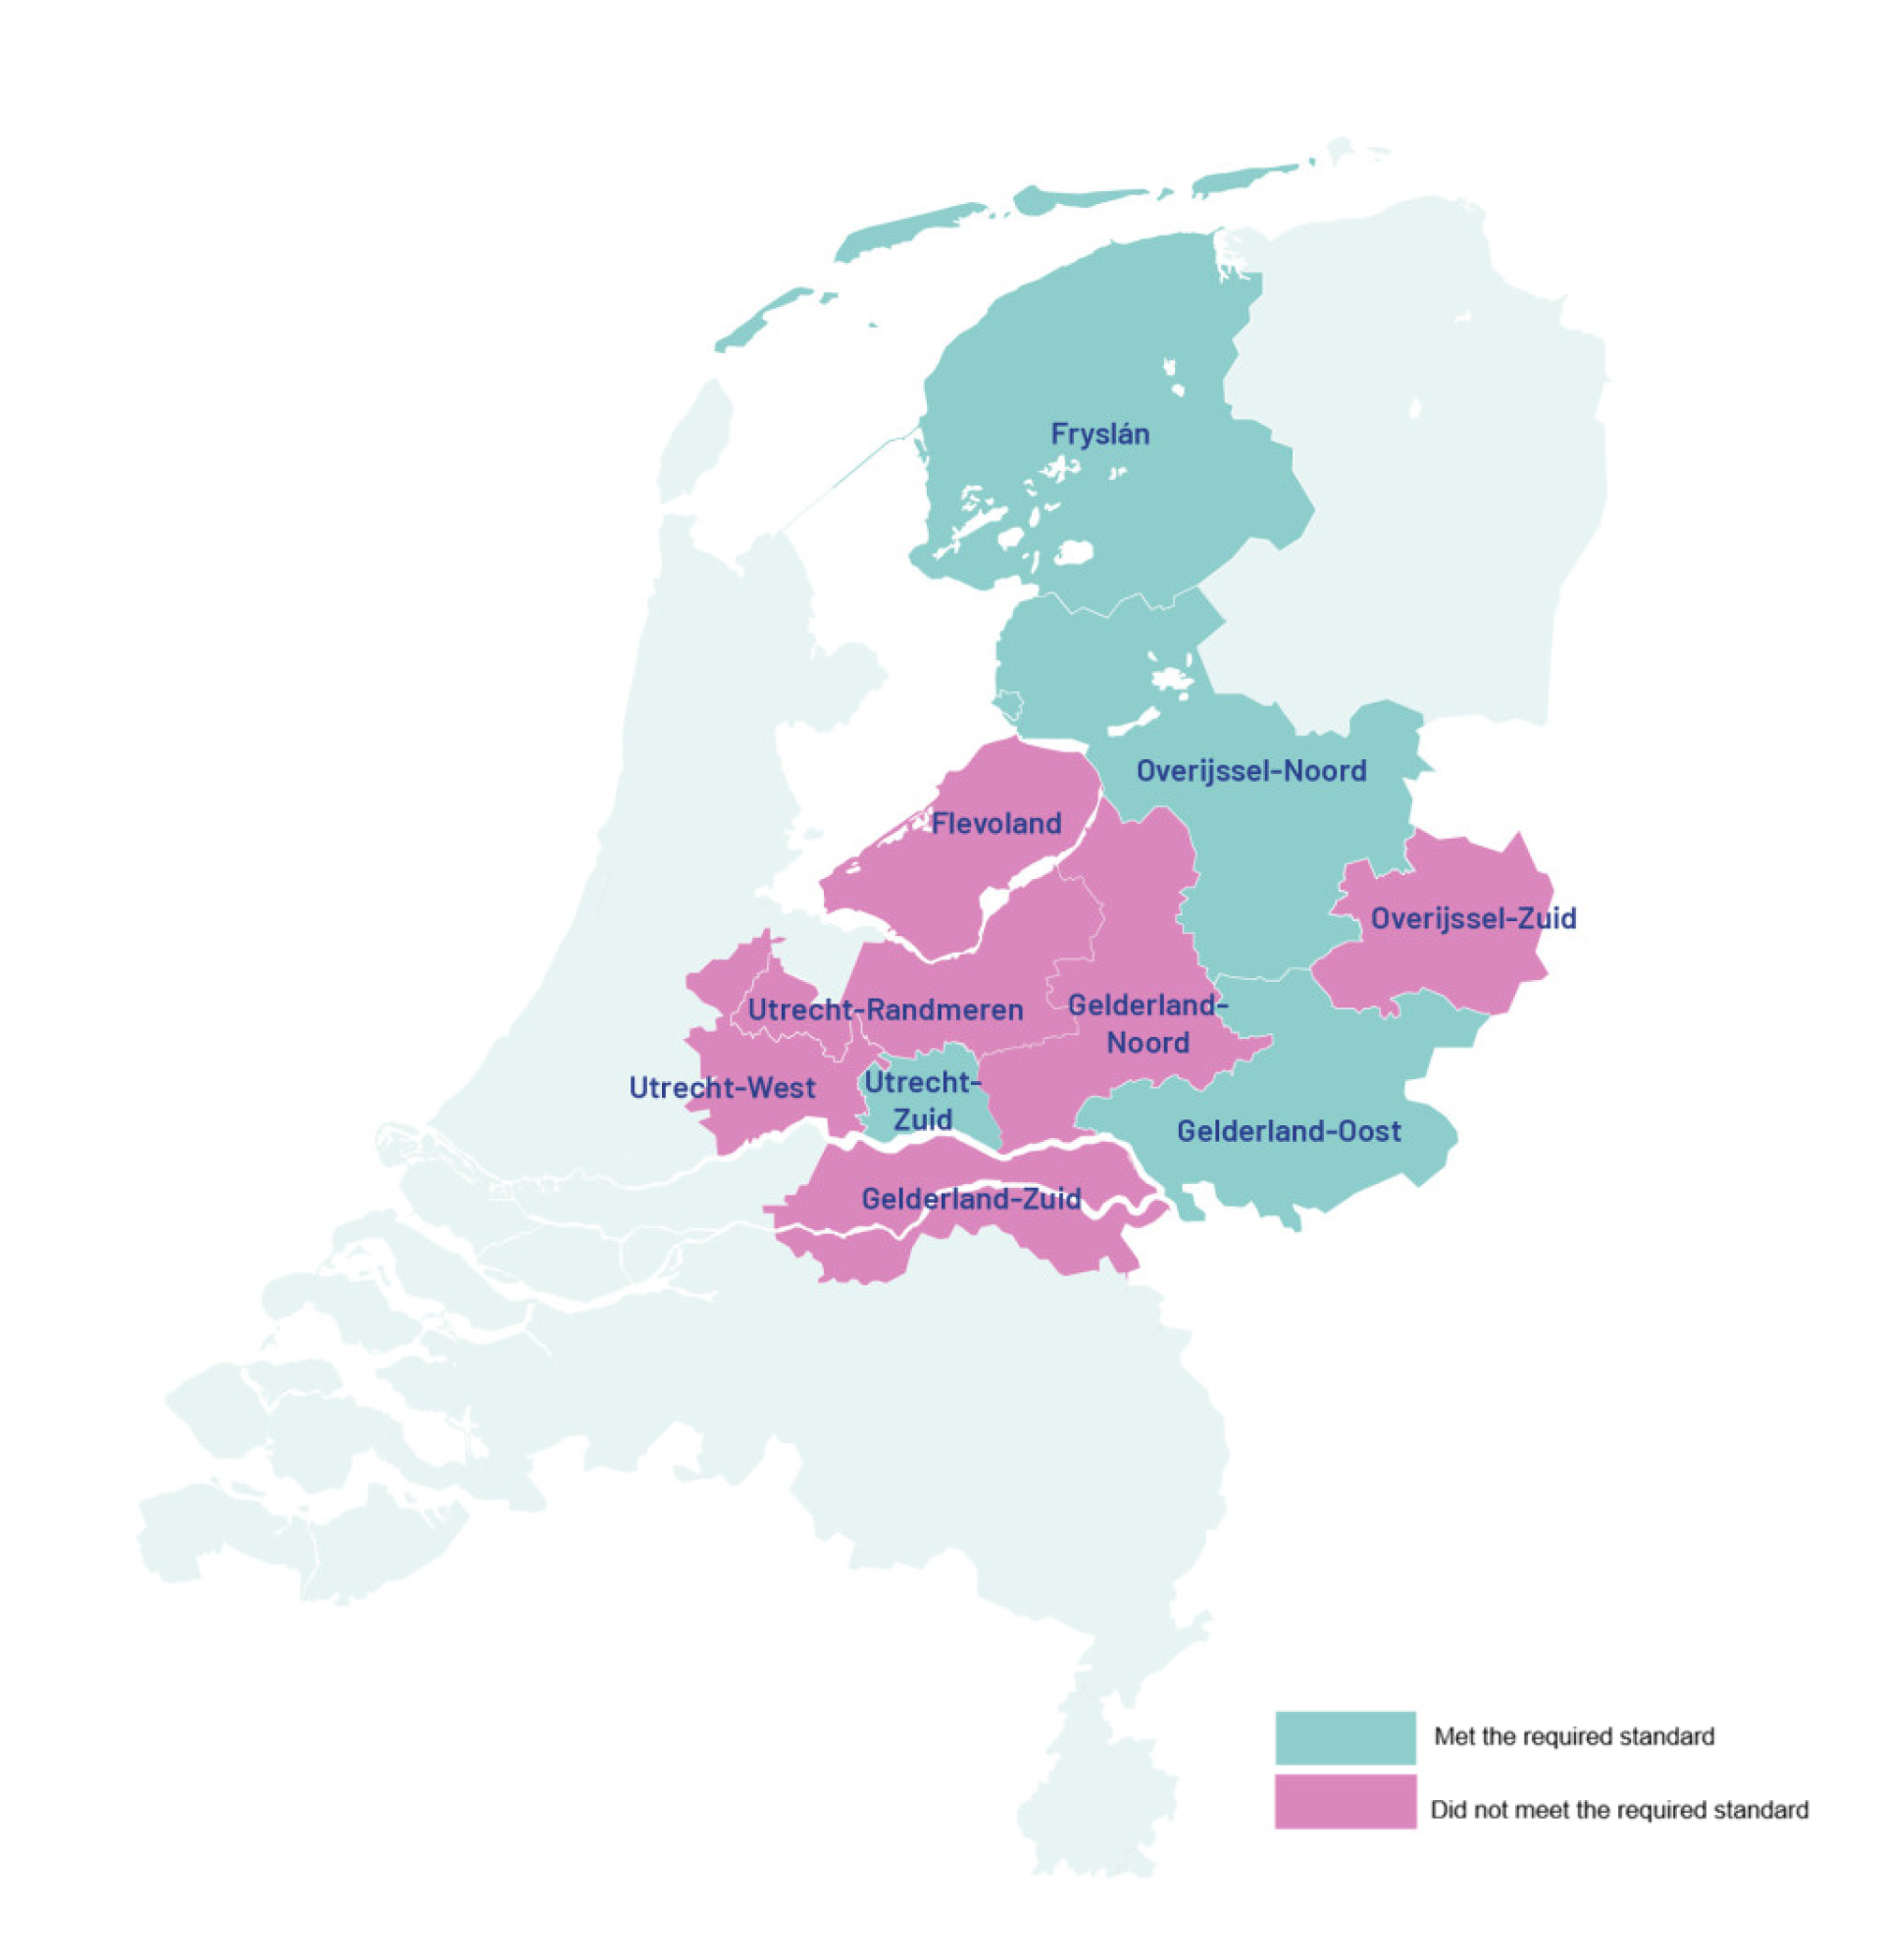
Vitens has set itself a target of having sufficient reserves for five clusters by 2025. Of the 10 clusters, only four have sufficient total reserves: Overijssel-North, Utrecht-South, Gelderland-East and Friesland. As a result, permit limits are occasionally exceeded. For the Friesland cluster, it should be noted that the permit for Luxwoude is not yet final and that objections are still pending. Based on current expectations, we will not meet our original target set in 2020 by 2030. We will therefore review our targets for the coming years next year, so that they better reflect current circumstances and available resources.
The map below shows geographically which clusters have sufficient licensing capacity:
Water saving
Through water‑saving measures, we aim to encourage conscious and sustainable use among households and business customers. Every drop that is not abstracted is the most sustainable drop.
Impact, risks, and opportunities
Water conservation has a positive impact on preventing water scarcity and directly contributes to security of supply. This reduces the need to expand abstractions and permitting capacity and helps limit additional investment pressure on production capacity.
In the table below, Vitens presents the impacts, risks and opportunities (IROs) as established in the materiality assessment.
| Sub-topic | Description of material impacts and/or financial risks and opportunities (own operation and value chain) |
|---|---|
| Impact materiality | Impact (positive): |
| • Water conservation among customers dampens peak demand and reduces the risk of water scarcity. |
Policies, actions, metrics, and targets
Policy
Vitens has a drinking water conservation policy, aimed at structurally reducing drinking-water demand among households and business customers. This policy is part of our strategy 'Together for drinking water. Now and in the future’ and aligns with the national objectives set out in the National Plan of Action on Drinking-Water Conservation. Within this framework, Vitens identifies risks such as rising water demand, permit scarcity and pressure on existing sources, and links these to concrete actions. The policy and associated concrete actions are set out in the Water Conservation Programme, the progress of which is monitored quarterly.
General actions
- Regional cooperation with provinces, water authorities and municipalities gained momentum in 2025: in the spring, the Overijssel Drinking Water Savings Action Plan was adopted, and after the summer the Utrecht Drinking Water Council was launched, with drinking water savings as one of its focus areas.
Actions targeting domestic use:
- The Water‑Efficient Neighbourhoods Construction Table has been extended to the provinces of Utrecht and Overijssel. This partnership, comprising the provinces, the Vallei and Veluwe Water Authority, Vitens and various private partners, is working to scale up rainwater utilisation and grey-water reuse in homes. In 2025, work began on developing a ‘Water-Efficient Living Guideline’, including safeguards for public health, which can be embedded in regional policy instruments and applied in procurement processes.
- Drinking water savings have been brought to residents’ attention through physical and online campaigns. In the lead-up to summer, a six-week campaign (12–25 May and 16 June–13 July) was carried out to reduce peak demand during hot and dry periods. We maintained a drinking water blog, engaged with the media, and kept municipalities, provinces and water authorities informed. With the shower cube and eco-washing machine, we were present at multiple locations, including the Nijmegen Four Days Festivities (shower cube visited 13,500 times), the Overijssel Liberation Festival (eco-washing machine visited 1,300 times) and the Hoog Catharijne shopping centre in Utrecht (eco-washing machine visited over 1,000 times). In the autumn, we ran the ‘Turn off the tap when you shave’ campaign on digital radio, social media and outdoor digital screens. Together with Scouting Nederland, we are raising awareness of water conservation among the 115,000 scouts in the Netherlands through a skills badge. In addition, 70,000 children in Vitens' region were reached during Tap Water Day.
- Some 125,000 customers completed the revised WaterWeter. This tool is free to use and helps households understand their water consumption and provides personalised saving tips.
Actions targeting business use:
- For the first time, we presented the Sustainable Water Award to a major customer that has made significant progress in reducing drinking water consumption. Lelystad Airport Businesspark was the first.
- Flevoland has taken the lead in circular industrial water use with the creation of the Industrial Water Use Platform Flevoland. Industry, knowledge institutions, government bodies and Vitens are working together on effective solutions to the drinking water shortage. In other regions, we are involved through initiatives such as Waterkoplopers Industrie Overijssel, Waterkoploppers Industrie Gelderland and Circulair Friesland.
- The FoodSafe Water project was launched during the ‘WijWater’ event at the Zwarte Cross. Through this initiative, Vitens supports companies in the food industry in reusing their process water.
- Twelve universities of applied sciences and universities ordered the water-saving package in 2025. This enables us to reach as many as 200,000 students through posters, shower and tap timers, leaflets, toilet stickers and large free-standing campaign boards. In earlier pilots, this resulted in drinking water savings of over 12%.
- We are a partner in several exploratory studies into promising collaboration projects across the water chain: the Nijkerk–Putten Water Roundabout, Zuiderzeeland eluent and McCain for a concrete plant, Wetterskip Fryslân eluent for the Bolsward textile laundry, and Vechtstromen eluent for industry in Twente.
- From 2025, Vitens will apply an increased rate for companies that consume more than 100,000 m3 drinking water per year for largely non-domestic applications. The rate (excluding VAT) for this so-called "Other water" is €1.34 per m3, compared to €1.15 per m3 for regular business consumption. This measure encourages companies to invest in water-saving technologies and alternative sources.
- Installing smart water meters (AMR) for small business customers, giving them faster and more accurate insight into their water use (KT/MT).
Metrics and targets
To meet drinking water demand, Vitens is focusing on securing additional permits and expanding production capacity, as well as reducing demand. We are contributing to the implementation of the National Drinking Water Savings Plan. It sets out the targets for 2035: 100 litres per person per day for all households, and a 20% reduction for all businesses in the service area compared with the average annual consumption over 2016–2019.
Vitens uses two metrics to measure and manage the progress and effectiveness of its water conservation policy:
- Average drinking water consumption per person per day, in litres
- Development of business drinking water demand, in percentages relative to the average annual consumption over 2016–2019.
| Metric | Target 2025* | Result 2025 | Result 2024 |
|---|---|---|---|
| Average daily drinking water consumption per person in litres ** | 125 | 119,1 | 119,5 |
| Development of non-domestic drinking water demand as a percentage compared with 2016–2019. | -6,3% | -0,6% | -1,8% |
Explanation:
Households: average consumption stands at 119.1 litres per person per day, well below the 2025 target of 125 litres. This confirms the downward trend seen since 2020, though additional reductions are required to meet the 2035 target of 100 litres.
Business use: the reduction is only 0.6% compared to 2016-2019, compared to 1.8% last year. The target for 2025 is a 6.3% reduction. Despite our initiatives, we are falling short of our target. This is partly due to autonomous developments: economic growth and an increase in the number of business customers. Initiatives for drinking water savings are insufficient to compensate for this autonomous development. On the other hand, our initiatives currently reach only a limited share of small business customers and drinking water savings among large business customers largely depend on government-led measures under the National Action Plan. As the Netherlands Court of Audit reported in May 2025, these measures are slow to get underway. Finally, an administrative correction was made to the customer classification, which increased the share of business consumption.
3.2.3 Biodiversity and ecosystems
In line with our strategy, we work with our stakeholders to ensure sufficient clean, reliable, and accessible drinking water. Now and in the future. Sustainability and nature form an important foundation: we are working towards a greener operation to support a resilient infrastructure. Nature and drinking water go hand in hand as a result. A healthy natural environment is the best protection for our sources. We therefore refer to the soil in our nature reserves (our water abstraction areas) as ‘Filter Zero'. To preserve clean water, we carry out ecological management in our water abstraction areas. This means that we do not use pesticides or fertilisers and instead support natural processes as much as possible. Because the cleaner the soil, the cleaner the groundwater - and the less treatment is needed to turn it into drinking water. Vitens does not make use of biodiversity offsetting; instead, we focus entirely on preventing negative impacts and strengthening biodiversity within our own water abstraction areas. In addition, our ecological management contributes to the conservation and restoration of biodiversity and strengthens existing nature networks and green-blue structure of the landscape.
Land degradation
Impact, risk and opportunity management
Pumping groundwater in our water abstraction areas can lower the phreatic groundwater level (the shallow groundwater close to the surface) in some locations or alter groundwater flows. This can have local negative effects on groundwater-dependent wildlife. As a result, there is a physical risk.
Each water abstraction area is situated in a unique environment with its own specific natural and biodiversity characteristics. For this reason, we do not apply a generic approach to our water abstraction areas; instead, we draw up a nature management plan for each area, tailored to local conditions. Core activities in these areas include the periodic mowing and removal of vegetation, the cleaning of watercourses, ponds and pools, and carrying out thinning operations in woodland clearings. We also clear woody vegetation, control invasive species, plant trees and shrubs where needed, and apply tree rings to enhance the structure and biodiversity.
The map below shows water abstraction areas located in Natura 2000 sites. These comprise a total of 25 groundwater abstraction areas. In the coming years, we will expand this map to include abstraction areas located near Natura 2000 sites.

In the table below, Vitens has identified the impacts, risks and opportunities (IROs) of groundwater abstraction.
| Sub-topic | Description of material impacts and/or financial risks and opportunities (own operation and value chain) |
|---|---|
| Impact materiality | Impact (negative): |
| • Groundwater extraction may lead to a groundwater level drop in the vicinity of the extractions or have a potentially negative impact on groundwater-dependent nature locally. Healthy nature is important because of the purifying effect of healthy soil. | |
| Financial materiality | Risk: |
| • Sites may have to be closed/relocated to spare nature and/or Vitens may have to purify more because there is more pollution in the water. |
Policies, actions, metrics, and targets
Policy
Vitens is responsible for the Drinking Water & Nature Policy. It stipulates that we manage these sites to achieve an optimal layout that safeguards existing natural values and biodiversity and strengthens them where feasible. From the nature-management perspective, the nature management plans help us to monitor this. This is included in the Management Plans & Nature‑Site Monitoring Policy Vitens.
Vitens manages more than 3,300 hectares of nature across 104 abstraction areas and is actively committed to conserving and restoring biodiversity on its own sites. For most water catchment areas under its own management, Vitens has a nature management plan drawn up. These plans follow a fixed cycle and a standardised format, aimed at high‑quality ecological management and the monitoring of natural values and biodiversity opportunities. They include, among other things, a:
- description of the site;
- review of the management carried out;
- field survey of the entire area’s flora;
- overview of validated fauna records, including field observations;
- presence or absence of invasive alien species;
- biodiversity scorecard as a supporting tool, showing what is going well on the site and where preconditions can be improved;
- ten‑year vision for the area;
- required management and site-development measures to strengthen and conserve the area’s biodiversity.
Seven to eight plans are updated annually.
Actions
- In 2025, eight nature management plans were updated (KT).
Metrics and targets
Vitens operates within statutory frameworks such as the Environment and Planning Act, the Environmental Quality Decree (Bkl) and provincial regulations, with the province acting as the competent authority for permitting and enforcement. For new abstractions, we apply for the necessary permits and carry out the required studies, such as environmental impact assessments and ecohydrological analyses. Through the permit application and the associated studies, we ensure compliance with national and international legislation applicable to the Dutch Nature Network and to Natura 2000 sites. This legislation aims to prevent ecological threshold values from being exceeded. We do not monitor these thresholds ourselves, but in complying with permit requirements, Vitens meets the standards set by competent authority. Because Vitens is compliant, its activities stay within the boundaries of the water system, preventing irreversible damage in these areas. Protected species are monitored where relevant to the work or for compliance with legislation and policy. Once a permit has been granted, we report the abstracted volumes on a monthly basis.
To effectively monitor the ecological function and biodiversity development of the water abstraction areas under our management, Vitens commissions an external party with specialised expertise in ecology and nature management to draw up 84 nature management plans. A nature management plan is not drawn up for all water abstraction areas, mainly because management in those cases lies with an external party. Nature management plans are updated on a 10-year cycle, with a review of objectives for each catchment area at the end of each term. The objective here is to preserve and, where possible, enhance biodiversity. This cycle creates a consistent basis for monitoring and managing biodiversity development.
The current 10-year term started in 2018 and ends in 2027. The aim is to monitor seven to eight nature management plans each year in a standardised and consistent manner, and to maintain this approach over the long term in order to keep a close eye on the sites and, in doing so, focus on the conservation and development of biodiversity. Up to 2025, 62 of the 84 nature management plans will have been updated, representing 74% of the current cycle. Due to mainly external management, Vitens does not prepare a nature management plan for all water catchments. A new cycle will begin in 2028 following a tender process, which may involve a longer lead time.
| Metric | Target 2025 | Result 2025 | Result 2024 |
|---|---|---|---|
| Percentage of updated nature management plans | 77% | 74% | 64% |
Explanation
The current 10-year cycle ends in 2027. With current capacity, seven to eight nature management plans can be delivered annually. This means that by the end of 2027, a nature management plan will not have been delivered for all areas. For the new cycle, an assessment is being carried out to determine how many nature management plans can be delivered annually and what timeframe is appropriate for the cycle to achieve its objectives.
Impacts on and dependencies of ecosystems
Groundwater is our primary source of drinking water. Protecting these sources is therefore essential for Vitens. Its quality is influenced by surface activities such as agriculture, industry, and housing construction. Soil contamination directly harms our sources: the cleaner the groundwater, the simpler the purification process.
Impact, risk and opportunity management
The quality of our groundwater sources is increasingly under pressure due to rising pollution, including emerging substances such as PFAS, pharmaceutical residues, drug discharges, and pesticides. With the rise in complex contaminants, groundwater treatment is becoming increasingly challenging and costly. Some production sites require additional treatment steps or innovative techniques such as membrane filtration. These measures come at a significant cost.
In the table below, Vitens has identified the impacts, risks, and opportunities (IROs) of these.
| Sub-topic | Description of material impacts and/or financial risks and opportunities (own operation and value chain) |
|---|---|
| Impact materiality | Impact (positive): |
| • By managing water catchment areas and exploiting the purifying properties of the soil, Vitens contributes to the preservation of clean drinking water sources and clean soil. This has a positive impact on drinking water quality and the ecosystem. | |
| Financial materiality | Risk: |
| • Soil contamination and ageing of groundwater can lead to additional groundwater treatment steps. | |
| • If groundwater sources become contaminated, it could limit the availability of drinking water. |
Policies, actions, metrics, and targets
Policy
Vitens is actively committed to protecting groundwater sources and operates within clear statutory frameworks to ensure sustainable drinking water supply. Provinces determine where drinking water may be abstracted and set regulations to protect these areas. Within these frameworks, we ensure that our activities are carried out with due care and, with close attention to soil and water quality.
There is no formal policy for protecting groundwater resources, but we apply strategic principles. In groundwater protection areas, we are working to realise the 'Agriculture and Soil Vision’. The aim of the vision is to ensure a sustainable, climate-resilient drinking water supply. We aim to achieve this by working closely with the agricultural sector (land users, cooperatives, and collectives), nature organisations and other local partners. Together, we are working to improve soil quality and prevent further pollution of our resources.
Vitens also operates within international and national regulations, including the Water Framework Directive (WFD), the Environment and Planning Act and the Environmental Quality Decree (Bkl). For new abstractions, permits are applied for, including the required studies such as environmental impact assessments and ecohydrological surveys. Key permits include the Water Act permit and, where applicable, the nature permit. These establish clear boundary conditions and safeguard against undue impacts on the water system.
Actions
We work at various levels with provinces, municipalities, nature organisations, ministries, water authorities, and national working groups to improve groundwater quality. This collaboration focuses on ensuring the continued availability of clean water for agriculture, nature and drinking-water production
Actions implemented in 2025 with short-term impact:
- Consultations on drafting area dossiers and implementation programmes
- Regional level (by province)
- National level (Rhine area file)
Actions from 2025 with medium to long-term impact:
- Organising knowledge sessions (agriculture, source quality, drinkable rivers);
- Regional Deal ‘Drinkable IJssel’ (mapping discharges, clean agriculture in the floodplains, the story of the IJssel) 2025–2028; Vitens is a partner;
- Regional Deal ‘Drinkable Vecht’ (including ambassador recruitment, guidance for residents and visitors of the Vechtdal on keeping the river clean, and youth activities to build awareness), 2025–2028; Vitens is partner.
Ongoing actions with medium to long-term impact:
- Engaging in dialogue with land users, businesses, and industry in and around groundwater protection areas;
- Participating in national working groups on emerging substances and the leaching of pesticides;
- Knowledge development and policy advocacy towards legislators and ministries, in collaboration with Vewin and RIWA Rhine.
Metrics and targets
We analyse the detected contamination in our drinking-water sources each year using the Pollution Index (VI).
The Pollution Index is designed to measure the pollutants present in abstracted groundwater, allowing us to identify the specific contaminants to which Vitens, as a drinking-water supplier, is exposed. The objective for the Pollution Index is that it should not deteriorate (i.e so that it remains stable or improves) compared with the previous year. The results of the Pollution Index are not reviewed by an external party. Because some of the substances we measure today infiltrated the groundwater many decades ago, the direct impact of Vitens on the index is limited in the short term.
The Pollution Index provides an indication of the level of contamination in the groundwater sources. The index indicates the difference between the current situation and source values (target values used by Vitens for raw water). This measure is designed to show long-term trends. The results of the Pollution Index are shared with ministries, provinces, municipalities and water authorities, and serve as input for policy development, such as adjusting regulations on polluting substances or tightening standards for polluters.
The index shows how many of which substances are present in raw water or spring water. The higher the index, the higher the number of undesirable substances and/or their concentrations. The substances are divided into four groups: macroparameters (nitrate, sulphate, hardness), pesticides, pharmaceuticals, and other industrial substances. These substances are measured in the raw water at each of our abstraction sites. A result of 0 means there is no exceedance of the source value for that substance. Any result above 0 indicates an exceedance. A result of 100 represents the highest level of exceedance. For each abstraction site, we add up the exceedances of all substances. We then take the average of all abstraction sites. This is the Pollution Index.
| Metric | Target 2025 | Result 2025 | Result 2024 |
|---|---|---|---|
| Pollution index (long-term) | 377 | 427 | 380 |
Explanation
The deterioration of the Pollution Index is mainly due to the tightening of standards (lowering of the source value) for four substances. In doing so, we are anticipating the adoption of the new drinking-water standards for PFAS and for metabolites of the pesticide metolachlor.
The tightening of the standards results in a deterioration of 72 in the Pollution Index. In other words: based on the standards (source values) used in last year’s Pollution Index, the index would have come out at 355.
Top 10 Pollution Index
To clarify the Pollution Index (VI), the overview below presents the top 10 contributors to the index, the extent of their contribution, and their associated substance (sub)groups.
Determining the index factor: if the source value is 0.1 µg/L and a concentration of 0.3 µg/L is measured, the exceedance is 0.2 µg/L. For the Pollution Index, the exceedance is expressed as a factor relative to the measurement. This means dividing 0.2 by 0.3 and multiplying by 100. This results in an outcome of 66. This then represents the contribution to the Pollution Index.
| Substance | Substance group | Substance subgroup | Source value (Long-term target value) in ug/L | Contribution to pollution index 2025 (value 427) |
|---|---|---|---|---|
| EDTA | Industrial substances | Complexing agents | 0,1 | 43 |
| Trifluoroacetic acid (TFA) | Industrial substances | PFAS | 0,1 | 37 |
| Sum of PFAS | Industrial substances | PFAS | 0.44 in ng PEQ/l | 34 |
| Metolachlor (ESA) | Pesticides | Herbicides | 0,01 | 28 |
| Metolachlor (Oxanilic Acid) | Pesticides | Herbicides | 0,01 | 27 |
| Total Hardness | General substances | Main parameters | 1.4 in mmol/L | 26 |
| MTBE | Industrial substances | Ethers | 0,01 | 17 |
| Tertiary Butanol | Industrial substances | Other organic substances | 0,1 | 16 |
| Bentazone | Pesticides | Herbicides | 0,01 | 15 |
| Dibutyl phthalate (DBP) | Industrial substances | Phthalates | 0,01 | 13 |